Tighter regulations trim sales BCREA 2012 09
•
0 gefällt mir•330 views

The British Columbia Real Estate Association reports that tighter regulations in the mortgage market have lead to lower home sales in BC.

Empfohlen
Empfohlen
Weitere ähnliche Inhalte
Was ist angesagt?
Was ist angesagt? (16)
Andere mochten auch
Andere mochten auch (20)
Ähnlich wie Tighter regulations trim sales BCREA 2012 09
Ähnlich wie Tighter regulations trim sales BCREA 2012 09 (20)
Mehr von Matt Collinge
Mehr von Matt Collinge (16)
Kürzlich hochgeladen
Kürzlich hochgeladen (20)
Tighter regulations trim sales BCREA 2012 09
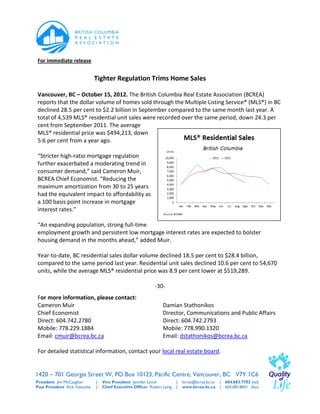
- 1. For immediate release Tighter Regulation Trims Home Sales Vancouver, BC – October 15, 2012. The British Columbia Real Estate Association (BCREA) reports that the dollar volume of homes sold through the Multiple Listing Service® (MLS®) in BC declined 28.5 per cent to $2.2 billion in September compared to the same month last year. A total of 4,539 MLS® residential unit sales were recorded over the same period, down 24.3 per cent from September 2011. The average MLS® residential price was $494,213, down 5.6 per cent from a year ago. “Stricter high-ratio mortgage regulation further exacerbated a moderating trend in consumer demand,” said Cameron Muir, BCREA Chief Economist. “Reducing the maximum amortization from 30 to 25 years had the equivalent impact to affordability as a 100 basis point increase in mortgage interest rates.” “An expanding population, strong full-time employment growth and persistent low mortgage interest rates are expected to bolster housing demand in the months ahead,” added Muir. Year-to-date, BC residential sales dollar volume declined 18.5 per cent to $28.4 billion, compared to the same period last year. Residential unit sales declined 10.6 per cent to 54,670 units, while the average MLS® residential price was 8.9 per cent lower at $519,289. -30- For more information, please contact: Cameron Muir Damian Stathonikos Chief Economist Director, Communications and Public Affairs Direct: 604.742.2780 Direct: 604.742.2793 Mobile: 778.229.1884 Mobile: 778.990.1320 Email: cmuir@bcrea.bc.ca Email: dstathonikos@bcrea.bc.ca For detailed statistical information, contact your local real estate board. 1420 – 701 Georgia Street W, PO Box 10123, Pacific Centre, Vancouver, BC V7Y 1C6 President Jim McCaughan | Vice President Jennifer Lynch | bcrea@bcrea.bc.ca | 604.683.7702 (tel) Past President Rick Valouche | Chief Executive Officer Robert Laing | www.bcrea.bc.ca | 604.683.8601 (fax)
- 2. Tighter Regulation Trims Home Sales . . . Page 2 September 2012 Residential Average Price, Active Listings and Sales-to-Active-Listings Data by Board Average Price Active Listings Sales-to-Active-Listings September September September September September September 2012 2012 2011 % 2012 2011 2011 Board % Residential Residential Residential change Residential Residential Residential change Sales to Active Average Price Average Price Active Listings Active Listings Sales to Active Listings (%) ($) ($) (Units) (Units) Listings (%) BC Northern 233,518 215,215 8.5 2,960 3,047 -2.9 10 12 Chilliwack 301,749 304,926 -1 1,792 1,887 -5 8.5 8.3 Fraser Valley 495,096 489,420 1.2 8,652 8,489 1.9 9.1 13.1 Greater Vancouver 722,681 751,042 -3.8 19,513 17,206 13.4 7.9 13.4 Kamloops 308,380 290,706 6.1 2,173 2,178 -0.2 8.6 8.7 Kootenay 287,997 285,725 0.8 3,190 3,386 -5.8 4.9 6.4 Okanagan Mainline 366,040 375,593 -2.5 6,272 6,524 -3.9 6.3 6.9 Powell River 202,637 211,311 -4.1 240 263 -8.7 9.6 9.9 South Okanagan 327,685 299,410 9.4 1,908 2,113 -9.7 6.6 5.8 Northern Lights 241,483 197,226 22.4 256 320 -20 19.5 18.4 Vancouver Island 310,679 332,741 -6.6 6,072 6,192 -1.9 7.1 9.2 Victoria 471,953 493,522 -4.4 4,097 4,011 2.1 9.8 10.9 Provincial Totals* 494,213 523,568 -5.6 57,125 55,616 2.7 7.9 10.8 *Numbers may not add due to rounding September 2012 BC Residential Multiple Listing Service® Data by Board Dollar Volume (000s) Units September 2012 September 2011 Board September 2012 September 2011 % change Residential Sales Residential Sales % change Residential Sales ($) Residential Sales ($) (Units) (Units) BC Northern 69,121 78,554 -12.0 296 365 -18.9 Chilliwack 46,168 47,569 -2.9 153 156 -1.9 Fraser Valley 391,621 542,767 -27.8 791 1,109 -28.7 Greater Vancouver 1,110,038 1,726,646 -35.7 1,536 2,299 -33.2 Kamloops 57,359 55,234 3.8 186 190 -2.1 Kootenay 44,639 62,002 -28.0 155 217 -28.6 Okanagan Mainline 144,220 167,890 -14.1 394 447 -11.9 Powell River 4,661 5,494 -15.2 23 26 -11.5 South Okanagan 40,961 36,828 11.2 125 123 1.6 Northern Lights 12,074 11,636 3.8 50 59 -15.3 Vancouver Island 133,592 188,997 -29.3 430 568 -24.3 Victoria 188,781 215,176 -12.3 400 436 -8.3 Provincial Totals* 2,243,234 3,138,793 -28.5 4,539 5,995 -24.3 * Numbers may not add due to rounding **NOTE: The Northern Lights Real Estate Board (NLREB) became part of the South Okanagan Real Estate Board (SOREB) on September 1, 2011. 1420 – 701 Georgia Street W, PO Box 10123, Pacific Centre, Vancouver, BC V7Y 1C6 President Jim McCaughan | Vice President Jennifer Lynch | bcrea@bcrea.bc.ca | 604.683.7702 (tel) Past President Rick Valouche | Chief Executive Officer Robert Laing | www.bcrea.bc.ca | 604.683.8601 (fax)
- 3. Tighter Regulation Trims Home Sales . . . Page 3 September 2012 Year-to-Date BC Residential Multiple Listing Service® Data by Board Dollar Volume (000s) Unit Sales Average Price % Board 2012 2011 % change % change 2012 2011 2012 2011 change ($) ($) ($) ($) BC Northern 757,273 665,662 13.8 3,235 3,028 6.8 234,087 219,836 6.5 Chilliwack 467,260 484,617 -3.6 1,565 1,616 -3.2 298,569 299,887 -0.4 Fraser Valley 5,212,611 5,967,440 -12.6 10,657 11,779 -9.5 489,126 506,617 -3.5 Greater Vancouver 15,141,995 20,956,066 -27.7 20,571 26,482 -22.3 736,085 791,332 -7.0 Kamloops 538,183 499,660 7.7 1,708 1,643 4.0 315,096 304,114 3.6 Kootenay 422,379 404,828 4.3 1,518 1,493 1.7 278,247 271,151 2.6 Okanagan Mainline 1,642,878 1,454,636 12.9 4,334 3,803 14.0 379,067 382,497 -0.9 Powell River 49,333 55,484 -11.1 225 247 -8.9 219,259 224,630 -2.4 South Okanagan 334,775 323,611 3.4 1,099 1,051 4.6 304,618 307,908 -1.1 Northern Lights 101,252 76,502 32.4 412 366 12.6 245,758 209,022 17.6 Vancouver Island 1,531,690 1,670,292 -8.3 4,831 5,084 -5.0 317,055 328,539 -3.5 Victoria 2,189,896 2,278,815 -3.9 4,515 4,535 -0.4 485,027 502,495 -3.5 Provincial Totals* 28,389,526 34,837,611 -18.5 54,670 61,127 -10.6 519,289 569,922 -8.9 * Numbers may not add due to rounding BCREA represents 11 member real estate boards and their approximately 18,000 REALTORS® on all provincial issues, providing an extensive communications network, standard forms, economic research and analysis, government relations, applied practice courses and continuing professional education (cpe). To demonstrate the profession’s commitment to improving Quality of Life in BC communities, BCREA supports policies that help ensure economic vitality, provide housing opportunities, preserve the environment, protect property owners and build better communities with good schools and safe neighbourhoods. For detailed statistical information, contact your local real estate board. MLS® is a cooperative marketing system used only by Canada’s real estate boards to ensure maximum exposure of properties listed for sale. 1420 – 701 Georgia Street W, PO Box 10123, Pacific Centre, Vancouver, BC V7Y 1C6 President Jim McCaughan | Vice President Jennifer Lynch | bcrea@bcrea.bc.ca | 604.683.7702 (tel) Past President Rick Valouche | Chief Executive Officer Robert Laing | www.bcrea.bc.ca | 604.683.8601 (fax)